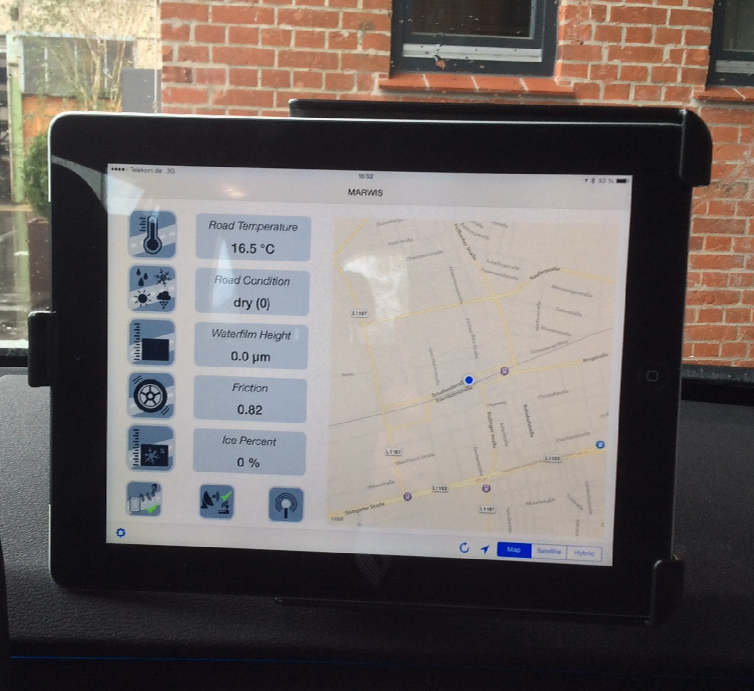
Physics explained easily: What exactly does the new mobile road sensor MARWIS output “Friction” mean? How does this affect the driving behavior of a vehicle? Here, this will be explained by Karl Schedler.
Out of the measurement of weather-related parameters on the road or airfield (such as ice percentage, water film height and surface temperature), the MARWIS calculates which average friction arises.
The term friction can be translated into traction or friction coefficient between tire and road surface. The friction coefficient is defined as the ratio between the brake force and the normal force affecting the tire surface area in physical terms (through the weight of the vehicle loading the tire). This definition is equivalent to another definition which may be better applicable in practice: The “friction” is the ratio of the average braking deceleration (at full braking!) to the acceleration due to gravity (gravitational acceleration measures very roughly 10 m/s2). The braking deceleration is a negative acceleration (therefore a change of velocity per time unit) and also expressed in “m/s2”. The relation is a dimensionless number.
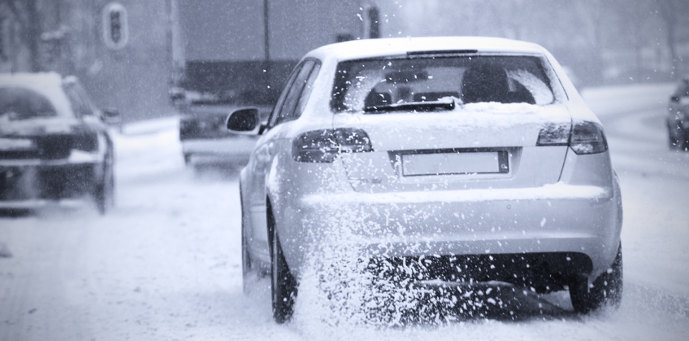
If you know these connections, the change of the friction value can help to estimate the impact on traffic, because it allows specifying the extension of the stopping distance for a given initial speed. Friction is thus a measure of how slippery the road is.
Figures based on experience showed, that an average road surface, which has been exposed to the traffic for a longer time, has a friction value of at least 0.82 in dry conditions. In wet weather the value can be reduced down to 0.55. A snow-packed road can have values between 0.5 and 0.2. Black ice values between 0.3 and 0.1 can occur, according to the type of black ice.
A friction reduction from 0.8 to 0.4 or from 0.6 to 0.3 means a doubling of the braking distance. From 0.8 to 0.2 a four time longer braking distance must be reckoned.
The winter services should try to avoid weather-related friction values dropping below 0.6 – if possible.
Do you want to learn more about the mobile road weather sensor Lufft MARWIS? Check out our landing page. Do you have further questions on the sensor or are you interested in getting a demo product? Just ask our team, which is happy to help you.

