In June 2021, our Application Development Manager Damon Nitzel participated in a webinar hosted by pv magazine. Joining forces with Troy Morlan of Nor-Cal Controls, and Carla Dawson of Relysm, the experts took a deep dive into environmental monitoring, SCADA integration, and solar panel cleaning using robotics and automation to increase awareness of soiling losses and emphasize the importance of long-term considerations during development.
Due to the high interest in the webinar, the organizers conducted a follow-up interview with the speakers Nitzel, Morlan, and Dawson based on the large number of questions arising during the one-hour session. In this post, we focus on a selection of questions that are both general and webinar related. If you didn’t attend the webinar when it aired live, fret not. Watch the recorded session below.
There were questions related directly to the content presented in the webinar as well as general questions. That is why we split the questions and answers in two sections. We added some insights from our scientist Marc Korevaar.
General questions and answers
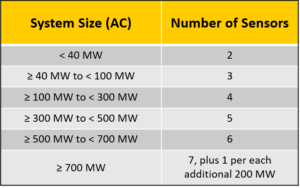
IEC 61724-1:2021 Class A sites require a minimum number of soiling sensors per MW. We recommend using this as a starting guideline to determine the quantity of sensors you need for the soiling measurements to be representative of the soiling through the arrays. Inter- and intra-site variability (farm activity, maintenance roads, atmospheric dust, car exhaust, etc) as well as cleaning zones are all factors to consider where additional soiling measurements might be needed to represent a unique area of soiling within a large site or amongst a portfolio of smaller sites.
We recommend one measurement per minute to have one correct daily value. There are situations, like sandstorms, where real-time data may give earlier warning of maintenance needs, but most sites per day will rarely use intra-day data. An exception would be higher soiling rate locations that are using fully automated solutions.
The DustIQ uses an internal LED to general the measured signal and collect soiling data, which is not influenced by irradiance, so irradiance values were not considered as part of this presentation. This also means the DustIQ provides data day and night as long as the surface of the sensor is dry. The soiling data presented were daily measurements at 2 pm, so it’s presumed the irradiance was greater than 100 W/m² for all measurement times, and also that the sensor is dry at this time of day with few exceptions.
Typically, automated solutions are expected to clean at least once per day. But, why limit yourself to a set schedule? Pairing automation and soiling data will save power and lifetime of the automation equipment and solar panel surface by only cleaning when it is necessary to optimize production, whether that is multiple times a day or skipping days.
Cleaning with water has to be done at some point in time. Dry cleaning is great for day to day soiling issue but eventually you have to clean with water because dry cleaning does not avoid cementation. Even in the driest parts of the world, there is dew and dew leads to cementation.
Great question. There are several ways clean bifacial modules.
- Custom robots – made to order
- A tractor with a brush
- Tractor with two hydraulic arms and two brushes. The brush can be used on both sides.
However, the ideal solution, which is a “custom” one, is a tractor with two hydraulic arms and two brushes. As it drives down the row it cleans twice as many panels.
Excellent question. Water is not recycled across the current cleaning methodologies. It is wasted and there certainly is room for improvement.
Yes. All the robots shown in the webinar can be used for snow and you can expect 100% efficiency.
This is a very good thing to look into. Before you buy any cleaning machinery, you should know the abrasion levels or, better yet, check if the machinery is certified by the PV panel manufacturer. For the systems shown, we do not have the abrasion levels because we have the PV panel manufacturers’ certification.
Air cleaning is being used and it works partially. It only works in very arid areas and some kind of brush or fabric is used with air to accomplish cleaning the PV panels. Air cleaning alone does not do the job.
To my knowledge there is no news of soiling-related degradation, but there could be as soiled areas usually get hotter. It can make sense to take weather forecasting (=rain frequency) into account to determine soiling loss over the lifetime. Rain is considered a cleaning mechanism for soiling.
DustIQ assumes there is uniform soiling.
Webinar-related questions
In this case study manual cleaning resulted in a higher revenue loss because the cost of manual cleaning was higher than the cost caused by performance loss while waiting for rain to do the cleaning. This does assume that the major rain event (the second event after the manual cleaning, seen in the blue line in the presentation) does completely clean the panels from a more heavily soiled state than they were in the actual data, so there may be a small (1-2%) error introduced by this assumption. Regions with lower labor rates may not pencil out the same, and manual cleaning will save revenue. In some cases, manual cleaning rates will be more effective than semi-automated tractor rates, such as in Pakistan where manual cleaning was reported as 200 Dollars per MW ($/MW).
The cleaning cost was included in the total savings calculation. Revenue loss is expected revenue, minus actual revenue. Actual revenue is energy sold, minus cleaning costs. When no action is taken, there are no cleaning costs, but also less production. When cleaning costs are higher than recovered production, this results in a net less (manual cleaning example). When cleaning costs are optimized, cleaning costs are less than recovered production and this results “savings” relative to taking no action (semi-automated examples).
For this case study, only for simplicity, we did assume that the entire 100 MW site was cleaned in a single day. In reality, 1-2 weeks would be a more realistic cleaning time frame. However, given consistent soiling rates present in this data, we do not believe there would be significant differences in the outcomes if we accounted for 1/12th cleaning per day.
For this case study we assumed that the soiling measurements were 100% representative of the soiling on the panels. A single sensor at a 100 MW site is unlikely to match this assumption, but increasing the soiling data density with multiple sensors will bring the soiling data closer to 100% representation of actual soiling on the panels. We expect intra-site variability and suggest installing soiling monitoring equipment in zones that are representative of unique circumstances. It’s quite possible partial site cleaning for more heavily soiled zones will be the most effective approach, or recover the most soiling loss, compared to cleaning a whole site averaged and treated as a whole.
Yes. The values shown in the webinar take into consideration solar panel cleaning robot operational expenditure values and more. The financial studies took into consideration O&M for the machinery and other factors.
For the final chart we used the tractor solution.
As far as we know there was work done in Spain and Morocco and an approach in Saudi Arabia. A publication about Morocco is in preparation, but not going very quickly already for some time. A publication from Spain and Morocco has been done. This one focuses more on the incidence angle effect and not on real soiling values.
Want to learn more about the impact of soiling and our soiling monitoring system DustIQ? Download our Case Study to discover how NOMADD, a manufacturer of automated cleaning robots, used the DustIQ to master the sand in the Arabian desert.
