OTT Rain Gauges Used in Remote Precipitation Monitoring Stations in Andes Mountains

The completed weather station at 18,537 ft in Peru. OTT Pluvio and Parsivel can be spotted on the left and right.

There are remote monitoring locations, and REMOTE monitoring locations!

Appalachian State University, in partnership with a multitude of other universities and the National Science Foundation, has undertaken the task of installing weather monitoring stations very high up in the Andes Mountains, on the Quelccaya Icecap (18,537 ft (5,650 m) ) in Peru and at Chacaltaya (16,929 ft (5,160 m) ) in Bolivia. Both stations included the OTT Pluvio2 Weighing Precipitation Gauge and the OTT Parsivel2 Weather Laser Disdrometer.

View of the installation site in Bolivia

Installing the weather stations at such high altitude was a challenge in itself. The Quelccaya Icecap station required over 500 lbs (225 kg) of equipment to be hauled up by foot! The stations will be helpful in improving scientific understanding of precipitation processes and patterns, the meteorological influences on chemical and isotopic properties preserved in the snow/ice, and the influence of precipitation on glacier dynamics in the region. Researchers are able to monitor weather conditions and station status via satellite telemetry so less hikes up to the station are required.

See some of the amazing photos below, and visit the Appalachian State blog to see more photos, videos, and background on the monitoring project!

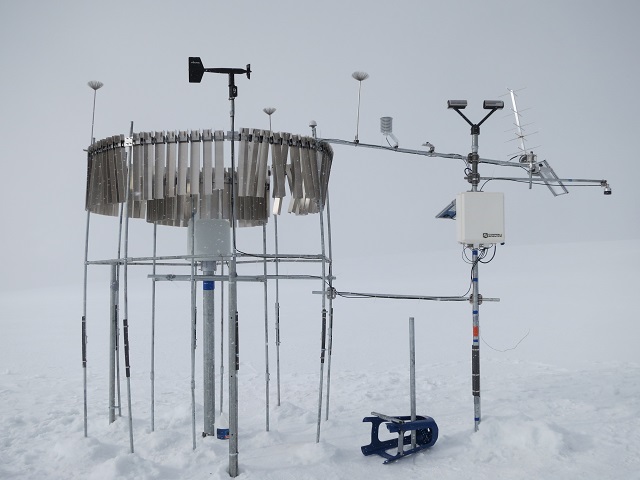
Weather Station Installation at the Quelccaya Icecap in Peru

Weather Station Installation at Chacaltaya in Bolivia

Carrying galvanized steel pipe for mounting OTT weather sensors up to 18,537 ft in Peru
The completed weather station at 18,537 ft in Peru. OTT Pluvio and Parsivel can be spotted in the background.
The completed weather station at 18,537 ft in Peru. OTT Pluvio and Parsivel can be spotted on the left and right.

You might also like these articles

PV Module IV Curve

PV Module IV Curve: A Definitive Guide to Understanding Solar Performance

A PV module IV curve is one of the most powerful tools available for understanding how a photovoltaic module actually performs under real‑world conditions. More than a theoretical plot, the IV (current-voltage) curve reveals...
Solar Energy
An expansive solar panel array stretches across a desert landscape, with sand dunes shaping the horizon. Hazy sunlight filters through, casting a warm glow over the scene, illustrating the intersection of technology and the environment.

Soiling, Performance Risk, and Capacity Testing in Utility‑Scale Solar

Why Measurement Strategy Matters More Than Ever Executive Summary Soiling is a well‑established cause of energy loss in photovoltaic (PV) systems. Less widely recognized is its impact during capacity and performance...
Solar Energy
Reducing Pyranometer Error

Reducing Pyranometer Error: Why Irradiance Accuracy Starts in Plant Design, Siting & Construction

Accurate irradiance data is the backbone of  solar project performance, bankability, and long-term investor confidence For EPCs, it shapes everything from yield assessments and energy modeling to commissioning acceptance tests and contractual guarantees. But this...
Solar Energy