One of the most important challenges, when designing monitoring facilities in remote locations, is resilience. Remote tide gauge systems operate in extremely harsh environments and require robust communications systems that almost never fail and are capable of storing large amounts of data locally as extra protection for data. Scientists from the National Oceanography Centre (NOC) are therefore upgrading the South Atlantic Tide Gauge Network (SATGN) to include the latest low power dataloggers with built-in satellite telemetry capability – the SatLink 3 from OTT HydroMet.
The SATGN is maintained and operated by the National Oceanography Centre, which is the UK centre of excellence for sea level monitoring, coastal flood forecasting and the analysis of sea levels. It is the focus for marine water level research in the UK and for the provision of advice for policymakers, planners and coastal engineers.
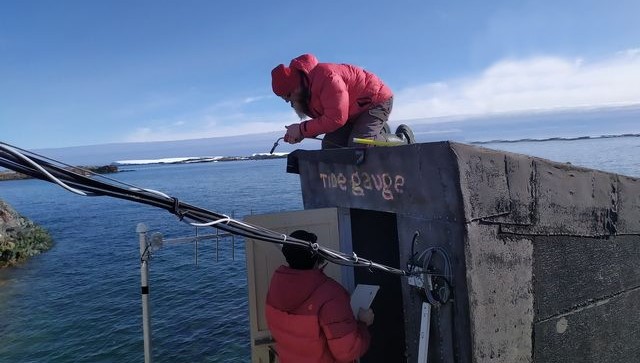
The SATGN measures sea levels in some of the most remote places on Earth. Monitoring sites include Antarctic locations such as Rothera and Vernadsky; located around 1,400 km below the southern tip of Argentina. Prior to the installation of this network, there was a lack of information on sea-level variations in the Southern Atlantic and bias in tide gauge records towards the more densely populated Northern hemisphere. Over the last 30 years, data from the SATGN have improved estimates of global sea-level change, such as those reported by the Intergovernmental Panel on Climate Change.
Read the whole story: