A PV module IV curve is one of the most powerful tools available for understanding how a photovoltaic module actually performs under real‑world conditions. More than a theoretical plot, the IV (current-voltage) curve reveals how current and voltage interact — and whether measured output reflects true system health or hidden performance losses.
For solar engineers, O&M teams, EPCs, and asset owners, PV module IV curve analysis plays a critical role in performance validation, fault detection, commissioning assurance, and long‑term reliability.
This guide explains what a PV module IV curve is, how to interpret it, what it reveals about system behavior, and why accurate environmental measurement is essential for meaningful analysis.
What is a PV module IV curve?
A PV module IV curve (current–voltage curve) is a graphical representation of the electrical behaviour of a photovoltaic module under illumination. Often referred to as the current–voltage (IV) curve, this measurement is a cornerstone of solar performance diagnostics across the PV system lifecycle.
The characteristic shape of a PV module IV curve arises from physical processes inside the solar cell. When sunlight is absorbed by the semiconductor material, electron–hole pairs are generated and separated by the internal electric field, creating current flow. At low voltages, current is primarily limited by internal resistive effects. As voltage increases, charge carrier recombination processes increasingly limit the available current, causing output current to decrease until it reaches zero at the open‑circuit voltage.
It plots:
- Current (I) on the vertical axis
- Voltage (V) on the horizontal axis
The curve is generated by sweeping the electrical load from open‑circuit to short-circuit conditions, or vice versa, and recording all possible operating points.
Under standard test conditions (STC) — 1000 W/m² irradiance, 25 °C cell temperature, AM 1.5 spectrum — the IV curve defines the module’s rated electrical characteristics. In the field, IV curves shift continuously as irradiance, temperature, and operating conditions change.
Because of this sensitivity, IV curves are widely used not only in module manufacturing and certification, but also during commissioning and targeted operational diagnostics.
Key parameters of a PV module IV curve
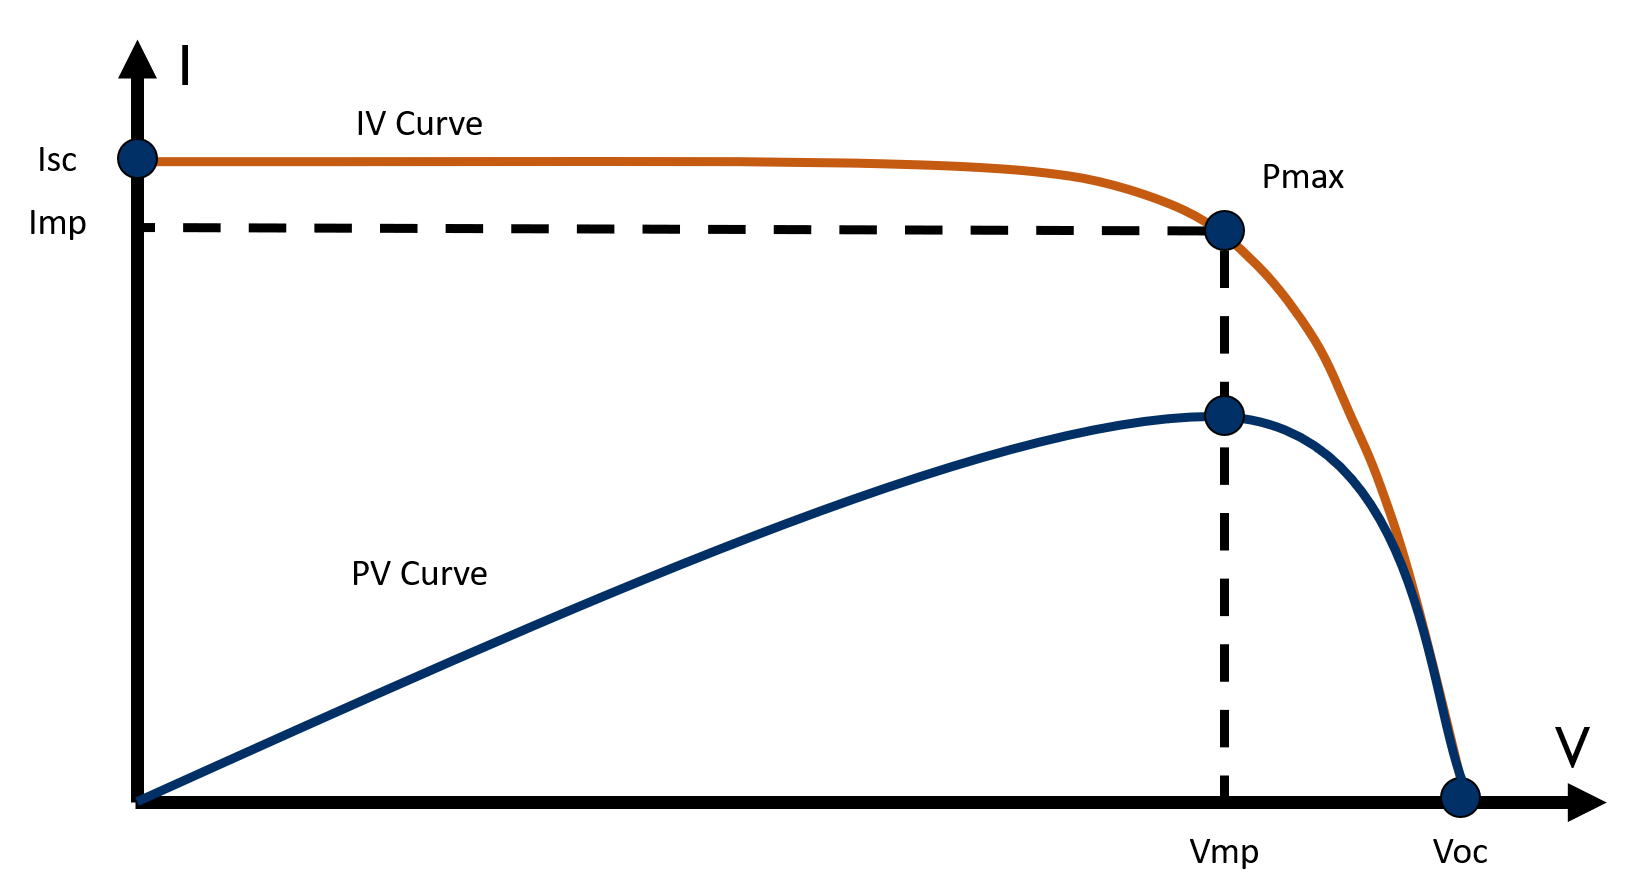
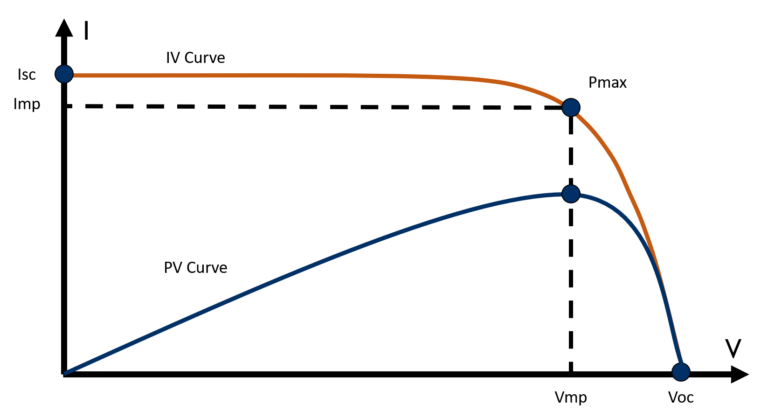
Understanding a PV module IV curve begins with four defining points:
- Short‑circuit current (Isc) – The maximum current is produced when voltage is zero.
Isc is directly proportional to irradiance and is often used to assess how much usable sunlight reaches the module. - Open‑circuit voltage (Voc) – The maximum voltage when no current flows.
Voc is highly temperature‑dependent and provides insight into cell behavior, long-term degradation, and electrical integrity. - Maximum power point (MPP) – The point where the product of voltage and current is highest: Pmax = Vmp × Imp. This is the operating target for inverters and maximum power point tracking (MPPT) algorithms.
- Fill factor (FF) – A dimensionless quality metric: FF = Pmax / (Voc × Isc) . Typical values: High‑quality crystalline silicon modules: 70–85%. A reduced fill factor often signals resistive losses, mismatch, or early degradation. Two internal electrical characteristics strongly influence fill factor: series resistance and shunt resistance. Series resistance arises from contacts, interconnects, and semiconductor material, and should be as low as possible to minimize power losses. Shunt resistance results from unintended current paths caused by material defects and should be as high as possible. Increases in series resistance or decreases in shunt resistance reduce fill factor and overall module efficiency.

How environmental conditions shape the PV module IV curve
A PV module IV curve is not static. Its shape and position shift continuously with environmental conditions.
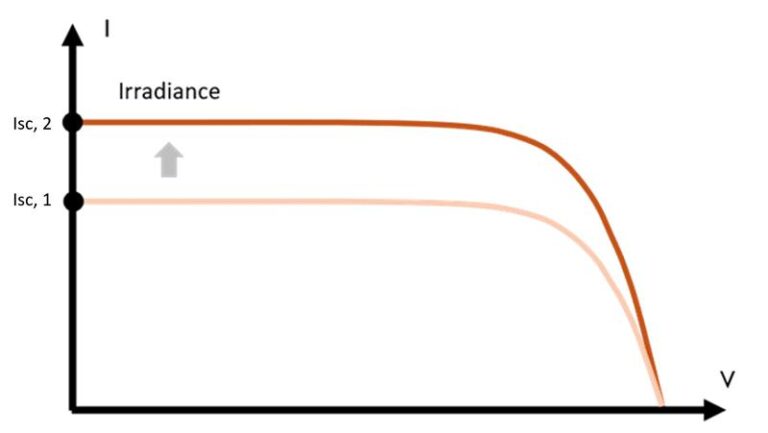
Irradiance effects
- Primarily affect Isc
- Lower irradiance compresses the curve vertically
- Shape remains similar if measurement is accurate
Temperature effects
- Primarily affect Voc
- Higher temperatures reduce voltage and power output
Soiling and shading
- Introduce distortions in curve shape
- Activate bypass diodes
- Reduce fill factor and power output
Because IV curves are so sensitive, accurate irradiance and temperature measurement is essential for correct interpretation. Without reliable environmental data, it becomes difficult to distinguish between true performance issues and normal operating variation.
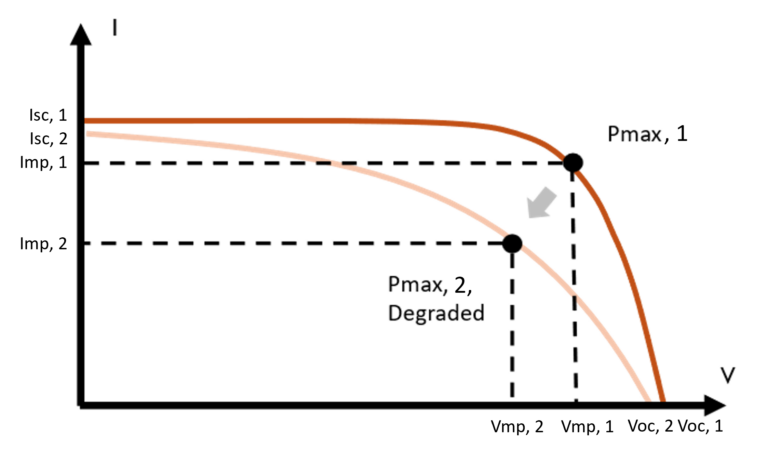
Degradation
- Primarily affects Pmax and fill factor
- Caused by environmental factors and electrical loading, etc.
What a PV module IV curve reveals about system performance
Beyond basic definitions, PV module IV curve analysis enables deeper diagnostics that are not always visible in aggregated KPIs such as energy yield or performance ratio alone.
IV curve analysis supports:
- Identification of soiling losses not evident in production data
- Detection of partial shading and mismatch
- Early warning of degradation trends
- Validation of commissioning quality
- Differentiation between environmental effects and true faults
In fleet‑scale systems, population‑level IV analysis helps isolate underperforming modules before yield losses escalate.
Common PV module IV curve defects and what they indicate
Common PV Module IV Curve Signatures | Likely Cause | Performance Impact |
Low Isc | Soiling, shading, reduced irradiance | Reduced power output |
Low Voc | High temperature, cell damage | Voltage clipping |
Rounded knee (low FF) | Series resistance, degradation | Lower Pmax |
Stepped curve | Bypass diode activation | Intermittent losses |
Compressed voltage leg | Cell mismatch, microcracks | Long‑term degradation |
These patterns are widely documented across field diagnostics literature. Under non‑uniform soiling or partial shading, losses in maximum power (Pmax) are not necessarily proportional to reductions in short‑circuit current (Isc). In these cases, relying on Isc‑based indicators alone can underestimate true power losses, making full IV curve analysis essential for accurate assessment.
Watch: PV module IV curve behaviour in real‑world conditions
The following field demonstration shows how IV curves behave under real operating conditions and why environmental correction is critical for interpretation.
Best practices for accurate PV module IV curve measurement
Reliable IV curve analysis requires:
- Stable irradiance conditions, typically above 600 W/m²
- Simultaneous measurement of irradiance and temperature
- Normalisation to reference conditions for meaningful comparison
- Traceable sensor calibration to minimise uncertainty
Without accurate environmental data, IV curves risk being misinterpreted — leading to false diagnostics or masking real performance issues.
Why measurement quality determines IV curve confidence
A PV module IV curve is only as trustworthy as the measurements behind it.
Sensor drift, angular mismatch, or poor temperature correction can distort the curve — making normal behaviour appear as underperformance or concealing genuine system issues. For this reason, measurement traceability, calibration discipline, and uncertainty awareness are foundational to credible IV curve analysis.
Reference‑grade irradiance measurement and well‑maintained sensors help ensure that IV curves support confident, data‑driven decisions rather than assumptions.
Applying IV Curve Analysis at Scale
As PV portfolios grow in size and complexity, the value of IV curve analysis extends beyond individual modules or one‑off diagnostics. Applied at scale, IV curves enable consistent performance assessment across strings, arrays, and entire fleets—supporting earlier detection of systemic issues, clearer differentiation between environmental effects and true faults, and more confident long‑term performance tracking. By combining IV curve data with accurate, traceable environmental measurements, teams can move from isolated troubleshooting toward repeatable, fleet‑level insight that supports operational decisions throughout the PV system lifecycle. In this context, IV curves serve not only as diagnostic tools, but also as a foundation for more detailed electrical performance modeling over time.
- Population‑level analysis – Comparing IV curves across large module populations helps identify systematic issues that may not be visible at string or inverter level.
- Bifacial module considerations – Rear‑side irradiance influences Isc and curve shape, requiring careful measurement of both front and rear plane‑of‑array conditions.
- IV curves and performance ratio (PR) – IV curves complement PR analysis by explaining why performance changes occur, rather than only how much output changes.
FAQs: PV module IV curve
Partial shading activates bypass diodes, creating stepped plateaus along the curve.
Typically, above 80% for high‑quality monocrystalline modules under STC.
Yes. Long‑term trends in Voc, FF, and curve shape reveal gradual degradation patterns.
Commonly during manufacturing, commissioning, and targeted O&M diagnostics.
Put IV Curve Insight into Practice
Understanding a PV module IV curve is the first step. Applying it consistently—across modules, strings, and entire portfolios—requires accurate measurement, reliable interpretation, and confidence in the data behind every curve.
Explore practical guidance and tools that help teams move from IV curve understanding to repeatable, data‑driven performance assessment.