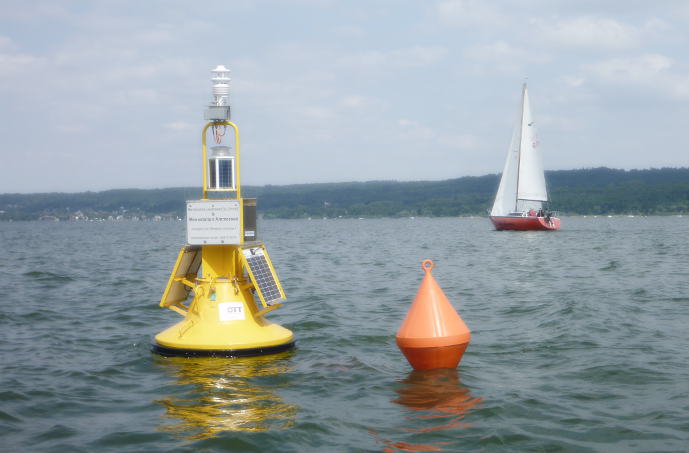
About one year ago our partner OTT Hydromet and the Office for Water Economy Weilheim delivered a buoy for climate and water control to the Bavarian State Office for Environment. On the third of July 2014, it has started it’s measurement work officially. How such a buoy is equipped, what it records and how it is installed, you can find this blog post…

Photo Credit: LfU Bavaria
About one year ago our partner OTT Hydromet, Kempten and the Office for Water Economy Weilheim delivered an air and water temperature buoy to the Bavarian State Office for Environment (LfU). On the third of July 2014, it started its work. In parallel, a website with detailed information about the this Ammersee project was published. It contents illustrative videos and reports (www.lfu.bayern.de).
The buoy is fixed through three tethers and serves the recording of temperatures in the water depth as well as weather data above the water surface by using a WS501-UMB from Lufft. It can reliably measure air pressure, air temperature, global radiation, relative humidity, wind direction and wind speed. The entire unit consumes so little energy that it can be powered independently by solar panels which are mounted laterally of the buoy. Under the body, there is a 78 meter long measuring chain, which is equipped with 16 temperature sensors and thus covers almost all depth ranges. This is placed at the deepest spot (81 meters) in Ammersee accuratly, which is located between Hersching and Riederrau. In the buoy’s inside lies a data collector and a mobile device transmitting the data to the server of LfU every 15 minutes.
The installation was a challenge, as the positioning had to be exact and in a very deep spot within the lake. First of all, they had to attach the three tethers and let a weight which was tied to a float, fall into the lake. The float had to prevent the weight from touching the lake ground, so a diver could correct the the exact location with the help of a GPS locator, after replacing the float with a smaller one. After this, the weight was drained on the lake ground and thus fixed to the exact position, which was calculated before. This was repeated twice. Then three small floats were removed and the tethers were tied to the measurement buoy finally. At last step, the chain with the temperature sensors must be drained carefully into the waterwith the help of a weight.
Since the activation, the continuous measurement runs smoothly. The water temperatures represent the most important parameters which can be assigned to the living conditions of lake ecosystems. Normally it is usual that for example the summer month come with an exchange between mixed and stratified temperature zones, which are separated by so-called thermoclines. In spring and autumn there are well-mixed conditions, which are easily affected by the winds at the surface. The increase in air temperature due to climate change will cause an adaption of the water temperatures and again influences the living conditions in lakes. How exactly this effect expresses itself, will now be explored by the new buoy technique, which was never used like this before. All data determined by the temperature sensors as well as by the WS501-UMB within the last five days are available on the homepage of the Bavarian State Office for Environment.
More information at www.lfu.bayern.de/wasser/ammerseeboje (in German only!)